Excel · C# walkthrough
Six-week workload trend
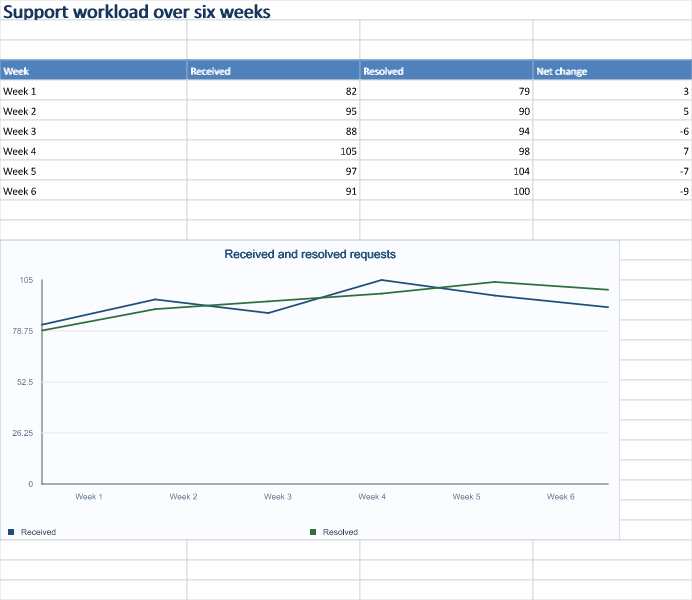
Read the source figures and their trend together. A chart helps show direction while the adjacent values keep the calculation inspectable.
- Start with
- Six weekly received and resolved counts
- Generate
- XLSX
How it works
Write the weekly values
Create a table with week labels, received counts, resolved counts and a formula for net change.
Link the chart to the range
Call AddChartFromRange with the labels and both series, choose a line chart and position it below the data.
Render a useful review range
Calculate formulas and export a range that includes both the table and chart.
The C# source
This is the complete example file used to generate the download. The walkthrough runner creates the output directory and produces the additional previews.
using OfficeIMO.Drawing;
using OfficeIMO.Excel;

namespace OfficeIMO.Examples.Showcase.Workflows;

/// <summary>Builds a six-week workload chart from editable worksheet values.</summary>
internal static class OperationalTrends {
    internal static void Create(string folder) {
        using ExcelDocument document = ExcelDocument.Create(Path.Combine(folder, "example.xlsx"));
        var sheet = document.AddWorksheet("Weekly trend");
        sheet.SetColumnWidth(1, 26); sheet.SetColumnWidth(2, 24); sheet.SetColumnWidth(3, 24); sheet.SetColumnWidth(4, 22);
        sheet.MergeRange("A1:D1"); sheet.Cell(1, 1, "Support workload over six weeks");
        sheet.CellFontSize(1, 1, 20); sheet.CellBold(1, 1, true); sheet.CellFontColor(1, 1, "17365D");
        string[] headers = { "Week", "Received", "Resolved", "Net change" };
        for (int column = 1; column <= 4; column++) sheet.Cell(4, column, headers[column - 1]);
        int[] received = { 82, 95, 88, 105, 97, 91 }, resolved = { 79, 90, 94, 98, 104, 100 };
        for (int index = 0; index < received.Length; index++) {
            int row = index + 5;
            sheet.Cell(row, 1, "Week " + (index + 1)); sheet.Cell(row, 2, received[index]); sheet.Cell(row, 3, resolved[index]);
            sheet.CellFormula(row, 4, $"B{row}-C{row}");
        }
        sheet.AddTable("A4:D10", hasHeader: true, name: "WeeklyWorkload", style: ExcelTableStyle.TableStyleMedium2);
        sheet.AddChartFromRange("A4:C10", row: 13, column: 1, widthPixels: 620, heightPixels: 300,
            type: ExcelChartType.Line, title: "Received and resolved requests");
        document.Calculate();
        sheet.Range("A1:D30").ExportImage(OfficeImageExportFormat.Png).Save(Path.Combine(folder, "preview.png"), OfficeImageExportFileConflictPolicy.Replace);
        document.Save();
    }
}
Run it from the source checkout
Clone the OfficeIMO repository and run this command from its root with the .NET 10 SDK. The first run restores the example project's dependencies.
dotnet run --project OfficeIMO.Examples -f net10.0 -- --showcase-workflows --showcase-example excel-operational-trendsThe files are written to OfficeIMO.Examples/bin/Debug/net10.0/Documents/Workflows/excel-operational-trends/. To use the example in your application, start with the Excel guide and its package setup.
Downloads and scope
What the preview shows
The linked C# example generates this file. The runner reopens and validates the XLSX and checks supported formulas, cached results and dependencies. The PNG is a native worksheet-range export.
What to keep in mind
The values are synthetic. The image is OfficeIMO's native worksheet rendering; desktop Excel chart appearance can differ.