PowerPoint · C# walkthrough
Results briefing with an editable chart
Give the audience a clear result while equipping the presenter to explain what the measurement supports.
- Start with
- Baseline and pilot response times plus decision notes
- Generate
- PPTX + PDF
How it works
Create chart data
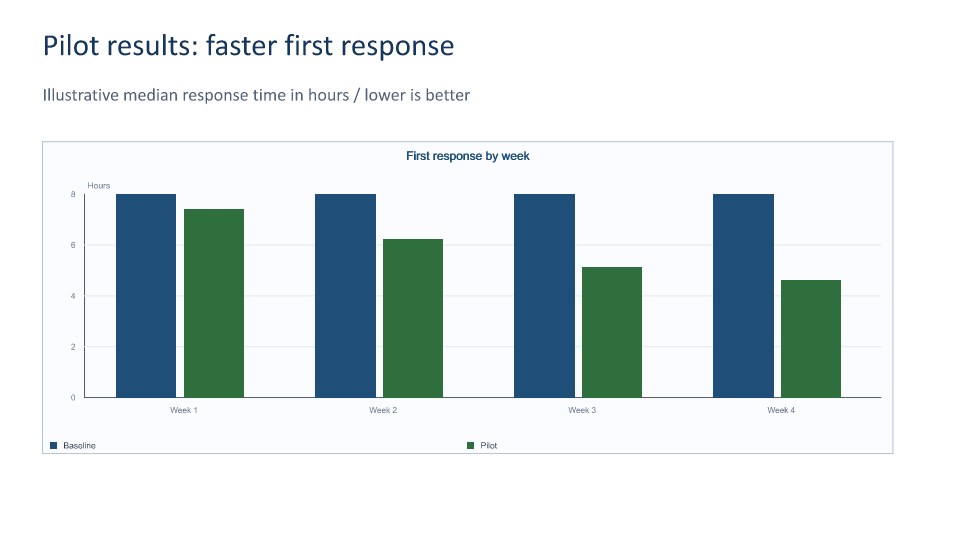
Define categories and two numeric series with OfficeChartData and OfficeChartSeries.
Build an editable chart
Add a clustered column chart, legend, value labels and axis title directly to the slide.
Explain the decision
Add a second slide for the next action and limits, and store presenter guidance in slide Notes.
The rest of the document
The C# source
This is the complete example file used to generate the download. The walkthrough runner creates the output directory and produces the additional previews.
using OfficeIMO.Drawing;
using OfficeIMO.PowerPoint;

namespace OfficeIMO.Examples.Showcase.Workflows;

/// <summary>Creates an editable results chart and speaker notes that explain the decision behind the numbers.</summary>
internal static class ResultsBriefing {
    internal static void Create(string folder) {
        using var deck = PowerPointPresentation.Create(Path.Combine(folder, "example.pptx"));
        var results = deck.AddSlide();
        Text(results, "Pilot results: faster first response", 1.5, 1, 30, 2, 31, "17365D");
        Text(results, "Illustrative median response time in hours / lower is better", 1.5, 3, 30, 1.3, 18, "526179");
        var data = new OfficeChartData(new[] { "Week 1", "Week 2", "Week 3", "Week 4" },
            new[] { new OfficeChartSeries("Baseline", new double[] { 8, 8, 8, 8 }),
                new OfficeChartSeries("Pilot", new double[] { 7.4, 6.2, 5.1, 4.6 }) });
        results.AddChartCm(OfficeChartKind.ColumnClustered, data, 1.5, 5, 30, 11)
            .SetTitle("First response by week").SetLegend(OfficeChartLegendPosition.Bottom)
            .SetDataLabels(showValue: true).SetValueAxisTitle("Hours");
        results.Notes.Text = "These are synthetic figures. Explain sample size and measurement rules before drawing a conclusion from real data. Compare the same response-time definition across weeks.";
        var decision = deck.AddSlide();
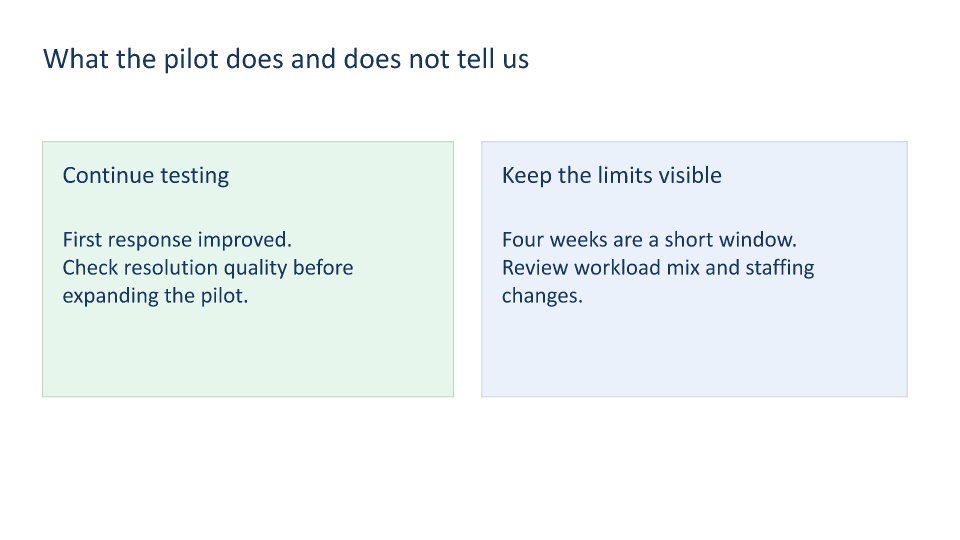
        Text(decision, "What the pilot does and does not tell us", 1.5, 1.5, 30, 2, 30, "17365D");
        decision.AddRectangleCm(1.5, 5, 14.5, 9).Fill("E7F6ED").Stroke("B5D8C0", 1);
        decision.AddRectangleCm(17, 5, 15, 9).Fill("EAF1FB").Stroke("CBD5E1", 1);
        Text(decision, "Continue testing", 2.2, 5.7, 13, 1.5, 25, "17365D");
        Text(decision, "First response improved.\nCheck resolution quality before expanding the pilot.", 2.2, 8, 12.7, 5, 23, "17365D");
        Text(decision, "Keep the limits visible", 17.7, 5.7, 13, 1.5, 25, "17365D");
        Text(decision, "Four weeks are a short window.\nReview workload mix and staffing changes.", 17.7, 8, 13, 5, 23, "17365D");
        decision.Notes.Text = "Ask the service owner to agree the next observation window and the quality measure. Avoid treating the synthetic chart as evidence about an actual service.";
        deck.Save();

        void Text(PowerPointSlide slide, string text, double x, double y, double width, double height, int size, string color) {
            var box = slide.AddTextBoxCm(text, x, y, width, height); box.FontSize = size; box.Color = color;
        }
    }
}
Run it from the source checkout
Clone the OfficeIMO repository and run this command from its root with the .NET 10 SDK. The first run restores the example project's dependencies.
dotnet run --project OfficeIMO.Examples -f net10.0 -- --showcase-workflows --showcase-example powerpoint-results-briefingThe files are written to OfficeIMO.Examples/bin/Debug/net10.0/Documents/Workflows/powerpoint-results-briefing/. To use the example in your application, start with the PowerPoint guide and its package setup.
Downloads and scope
What the preview shows
The linked C# example generates this file. The runner reopens and validates the PPTX, then exports each slide and a PDF review copy.
What to keep in mind
The data is invented. The PPTX preserves the chart and notes; PNG and PDF previews show slides rather than presenter mode.