PowerPoint · C# walkthrough
Sales pipeline review
Keep pipeline value distinct from contracted revenue while identifying the next useful actions.
Opens the generated download in a local browser tool. The C# example below creates the document.
- Start with
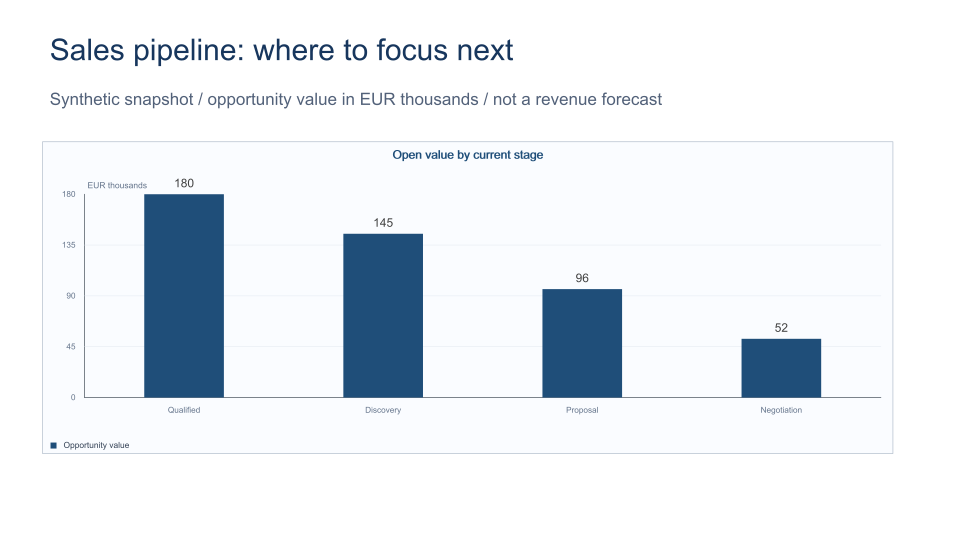
- Opportunity value by current stage
- Generate
- PPTX + PDF
How it works
Group by current stage
Count each opportunity once in the chart data.
Label the units
Show EUR thousands and explain that this is open pipeline.
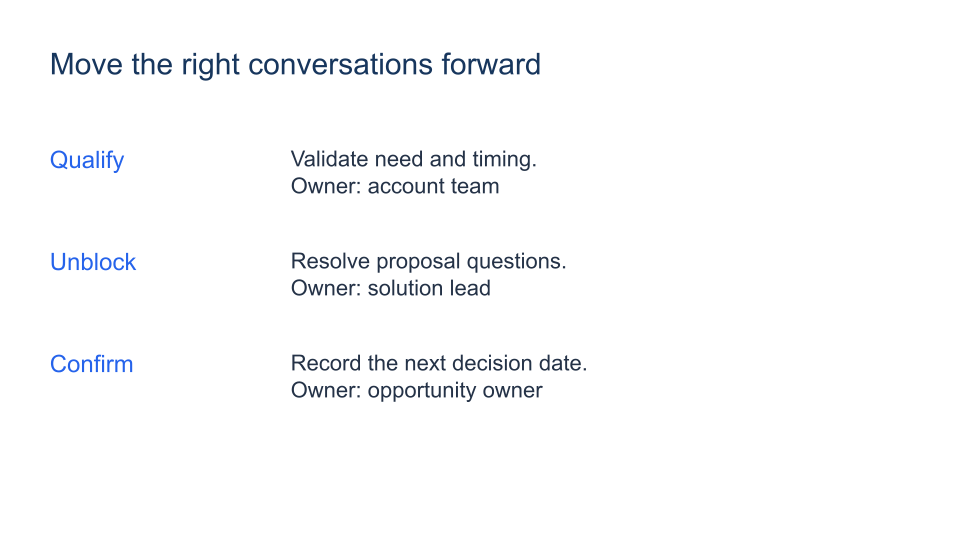
Assign the next action
Separate qualification, blockers and decision dates.
The rest of the document
The C# source
The example below shows the document API and layout used for this report. Follow the PowerPoint guide for package setup in your own project.
using OfficeIMO.Drawing;
using OfficeIMO.PowerPoint;

namespace OfficeIMO.Examples.Showcase.Workflows {
    /// <summary>Shows pipeline value by stage separately from committed revenue and assigns review actions.</summary>
    internal static class SalesPipelineBrief {
        internal static void Create(string folder) {
            using var deck = PowerPointPresentation.Create(Path.Combine(folder, "example.pptx"));
            var pipeline = deck.AddSlide();
            Text(pipeline, "Sales pipeline: where to focus next", 1.5, 1, 30, 2, 30, "17365D");
            Text(pipeline, "Synthetic snapshot / opportunity value in EUR thousands / not a revenue forecast", 1.5, 3, 30, 1.5, 17, "526179");
            var data = new OfficeChartData(new[] { "Qualified", "Discovery", "Proposal", "Negotiation" },
                new[] { new OfficeChartSeries("Opportunity value", new double[] { 180, 145, 96, 52 }) });
            pipeline.AddChartCm(OfficeChartKind.ColumnClustered, data, 1.5, 5, 30, 11)
                .SetTitle("Open value by current stage").SetDataLabels(showValue: true).SetValueAxisTitle("EUR thousands");
            pipeline.Notes.Text = "Each opportunity appears in one current stage. Do not add stage percentages or describe this as contracted revenue. Values are synthetic.";
            var actions = deck.AddSlide();
            Text(actions, "Move the right conversations forward", 1.5, 1.5, 30, 2, 30, "17365D");
            string[] titles = { "Qualify", "Unblock", "Confirm" };
            string[] bodies = { "Validate need and timing.\nOwner: account team", "Resolve proposal questions.\nOwner: solution lead", "Record the next decision date.\nOwner: opportunity owner" };
            for (int i = 0; i < 3; i++) {
                double y = 5 + i * 3.6;
                Text(actions, titles[i], 1.5, y, 7, 1.5, 24, "2563EB");
                Text(actions, bodies[i], 10, y, 21, 2.7, 22, "243247");
            }
            actions.Notes.Text = "Use the real CRM snapshot date and keep confidential customer details out of public examples.";
            deck.Save();
        }
        private static void Text(PowerPointSlide slide, string value, double x, double y, double width, double height, int size, string color) {
            var box = slide.AddTextBoxCm(value, x, y, width, height); box.FontSize = size; box.Color = color;
        }
    }
}
API used in this example
Use this in your project
Use a dated CRM snapshot and a consistent currency; do not present the synthetic values as a forecast.
The PowerPoint guide explains package setup and related document APIs.
Documents and scope
What the preview shows
The C# source generates the downloadable file. The runner reopens the editable document, validates Open XML where applicable and exports a PDF. Page previews come from the generated output.
What to keep in mind
Use a dated CRM snapshot and a consistent currency; do not present the synthetic values as a forecast.