Project · C# walkthrough
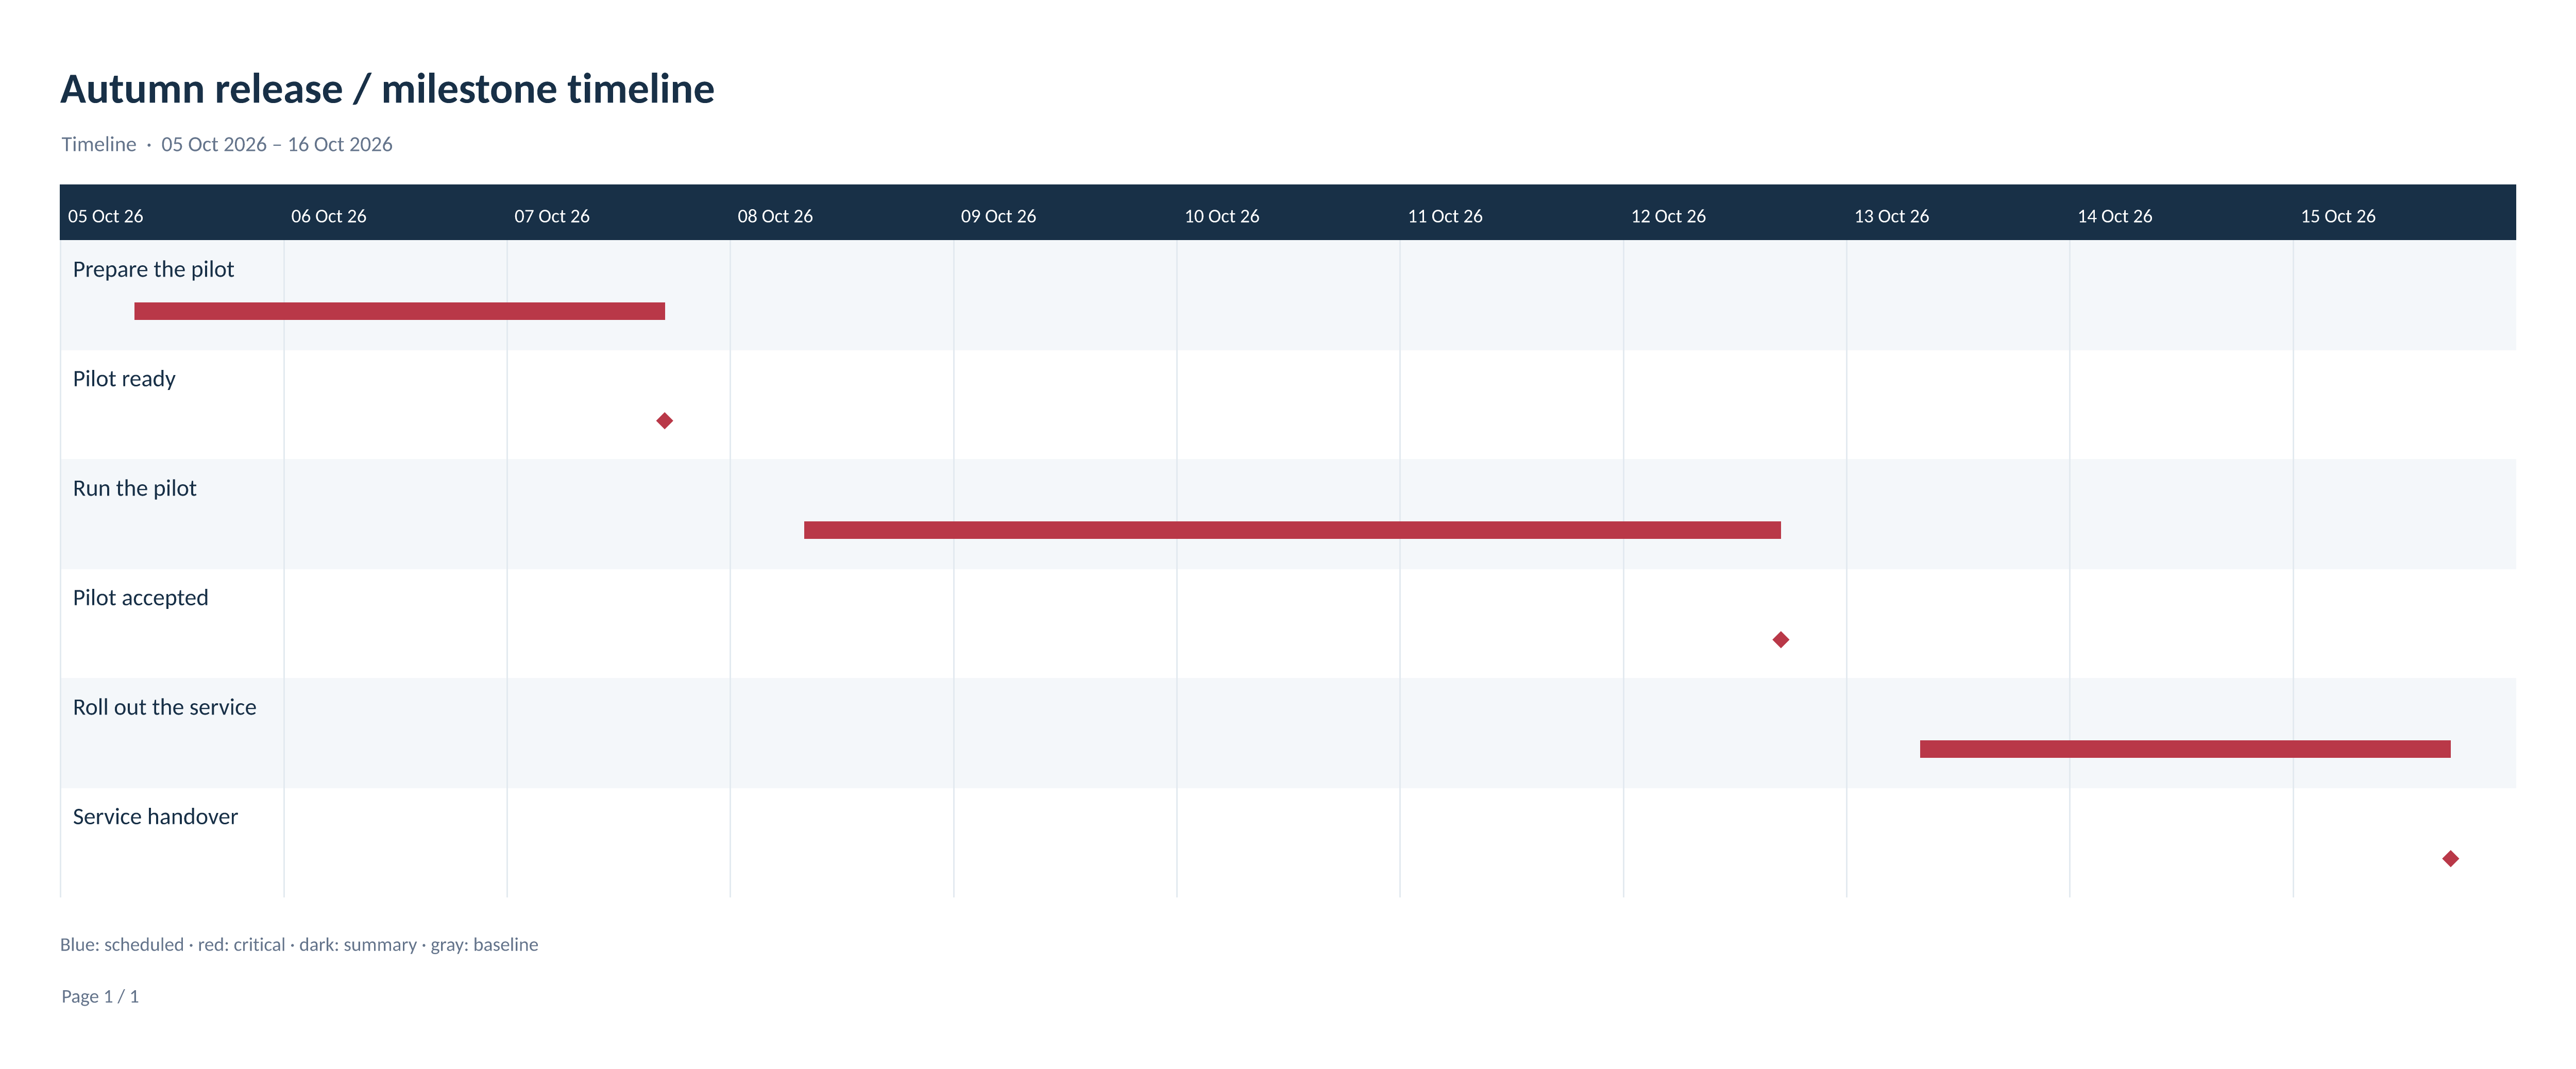
Release milestone timeline
Present the route from pilot preparation to service handover, with visible decision milestones and editable supporting data for the people reviewing the plan.
- Start with
- Release phases and decision milestones
- Generate
- XML + PNG + SVG + PDF + PPTX + XLSX
How it works
Model phases and milestones
Create three working phases and three zero-duration milestones, connected in delivery order.
Create the timeline snapshot
Calculate dates against an explicit working-week calendar and select the Timeline view with daily time buckets.
Share charts and editable data
Export PNG, SVG, and PDF, then create a PowerPoint report with a chart and data slides and an Excel workbook with typed report values.
The C# source
This is the complete example file used to generate the download. The walkthrough runner creates the output directory and produces the additional previews.
using OfficeIMO.Drawing;
using OfficeIMO.Project;
using OfficeIMO.Workflows;

namespace OfficeIMO.Examples.Showcase.Workflows;

/// <summary>Creates a release timeline and a PowerPoint report with charts and editable data.</summary>
internal static class ProjectMilestoneTimeline {
    internal static void Create(string folder) {
        using var project = ProjectDocument.Create();
        project.Name = "Autumn release / milestone timeline";
        project.Calendar = project.Calendars.AddStandardWorkingWeek();
        project.Settings.StartDate = new DateTime(2026, 10, 5, 8, 0, 0);
        string[] names = { "Prepare the pilot", "Pilot ready", "Run the pilot", "Pilot accepted", "Roll out the service", "Service handover" };
        var tasks = names.Select((name, index) => {
            var task = project.Tasks.Add(name);
            task.Duration = ProjectDuration.WorkingDays(index % 2 == 1 ? 0 : 3);
            return task;
        }).ToArray();
        for (int index = 1; index < tasks.Length; index++)
            project.Dependencies.Add(tasks[index - 1], tasks[index]);

        var schedule = project.CalculateSchedule();
        schedule.Report.ThrowIfErrors();
        var view = project.CreateView(schedule, new ProjectViewOptions {
            Kind = ProjectViewKind.Timeline, Timescale = ProjectViewTimescale.Day,
            PageWidth = 1200, PageHeight = 675,
            Columns = new[] { ProjectViewColumn.Name }
        });
        project.ApplySchedule(schedule);
        project.Save(Path.Combine(folder, "example.xml"));

        string fonts = Path.Combine(AppContext.BaseDirectory, "Assets", "Fonts");
        var faces = new OfficeFontFaceCollection()
            .Add("Arial", File.ReadAllBytes(Path.Combine(fonts, "Carlito-Regular.ttf")))
            .Add("Arial", File.ReadAllBytes(Path.Combine(fonts, "Carlito-Bold.ttf")), OfficeFontStyle.Bold);
        var typography = new OfficeRenderingProfile("timeline-report", faces, OfficeManagedTextShapingProvider.Instance);
        var images = new ProjectImageExportOptions().UseRenderingProfile(typography).UseQuality(OfficeImageExportQuality.Print);
        File.WriteAllBytes(Path.Combine(folder, "preview.png"), ProjectReportWorkflow.ExportImages(view, options: images).Single().Bytes);
        File.WriteAllText(Path.Combine(folder, "preview.svg"), ProjectReportWorkflow.ToSvg(view, typography).Single());
        File.WriteAllBytes(Path.Combine(folder, "preview.pdf"), ProjectReportWorkflow.ToPdf(view, typography: typography));
        using var slides = ProjectReportWorkflow.CreatePowerPoint(view, new ProjectOfficeReportOptions { Images = images });
        slides.Save(Path.Combine(folder, "report.pptx"));
        using var workbook = ProjectReportWorkflow.CreateExcel(view);
        workbook.Save(Path.Combine(folder, "report.xlsx"));
    }
}
Run it from the source checkout
Clone the OfficeIMO repository and run this command from its root with the .NET 10 SDK. The first run restores the example project's dependencies.
dotnet run --project OfficeIMO.Examples -f net10.0 -- --showcase-workflows --showcase-example project-milestone-timelineThe files are written to OfficeIMO.Examples/bin/Debug/net10.0/Documents/Workflows/project-milestone-timeline/. To use the example in your application, start with the Project guide and its package setup.
Downloads and scope
What the preview shows
The complete C# example generates these exports. The runner reopens and validates the Project XML and any Office documents, and verifies the PDF page count. The preview is the actual 300-DPI PNG export.
What to keep in mind
Calculated report views do not reconstruct saved native Project view styles. Charts in Word and PowerPoint are images; accompanying data tables remain editable. PNG has a fixed pixel resolution; use SVG for vector zoom.